
Comments on the M 7.7 earthquake near Arawan (Pakistan), 24th October 2013

The earthquake of 24th September 2013 with the epicenter about 300 km north-west of Karachi reached a remarkable strength with a magnitude of 7.7 (USGS, 2013). The epicenter is located in an area surrounded by many faults. The fault lines run in northeast-southwest direction along the boundaries between the Arabian and Indo-Australian plate (Fig. 1). Along these fault lines several strong earthquakes have occurred in the past, including the one in northern Baluchistan near Quetta city in 1935. After the earthquake methods for earthquake resistant buildings were developed and the first regional building code (“The building code for Quetta Municipality 1937”) was implemented (Maqsood and Schwarz, 2010).
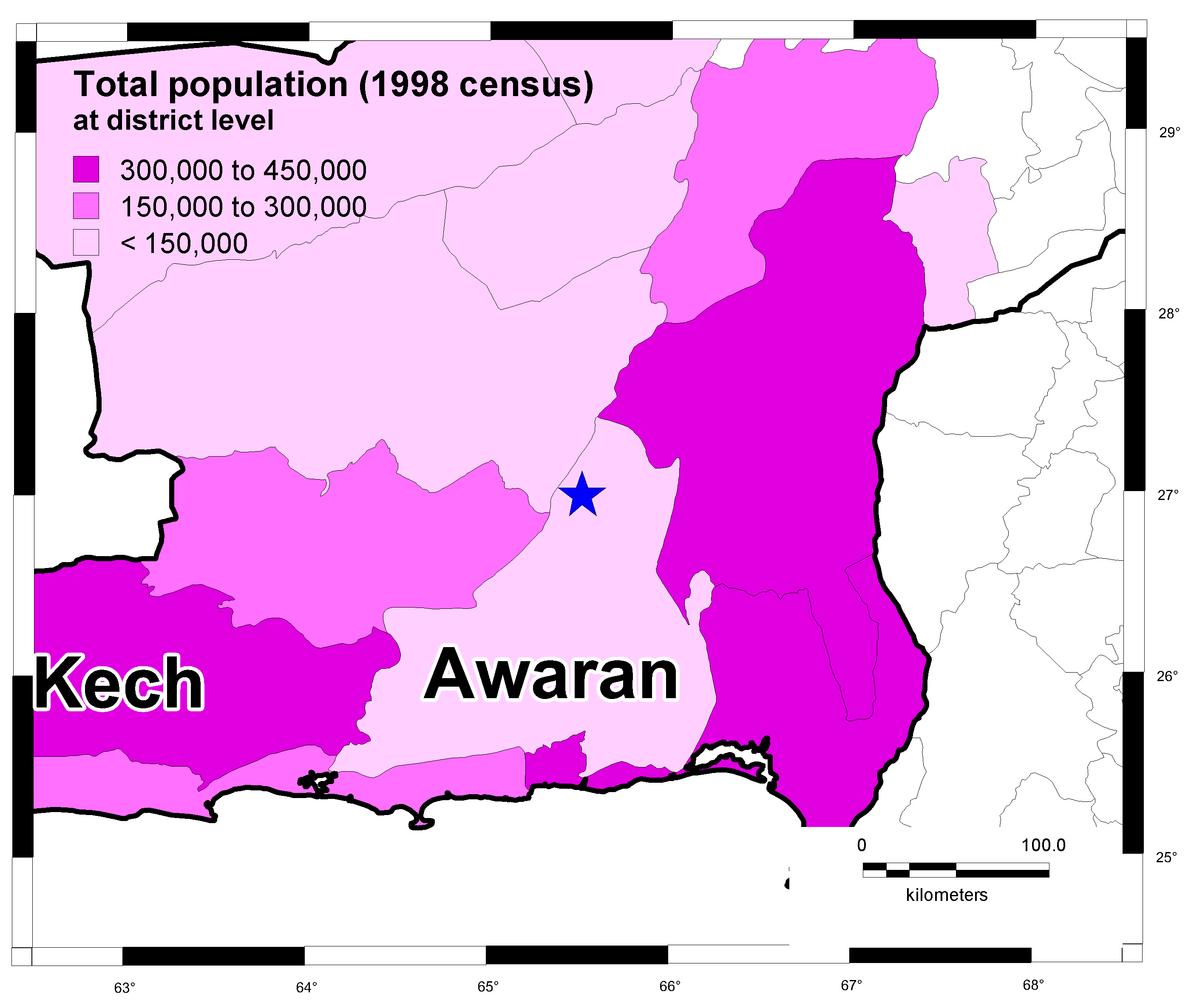
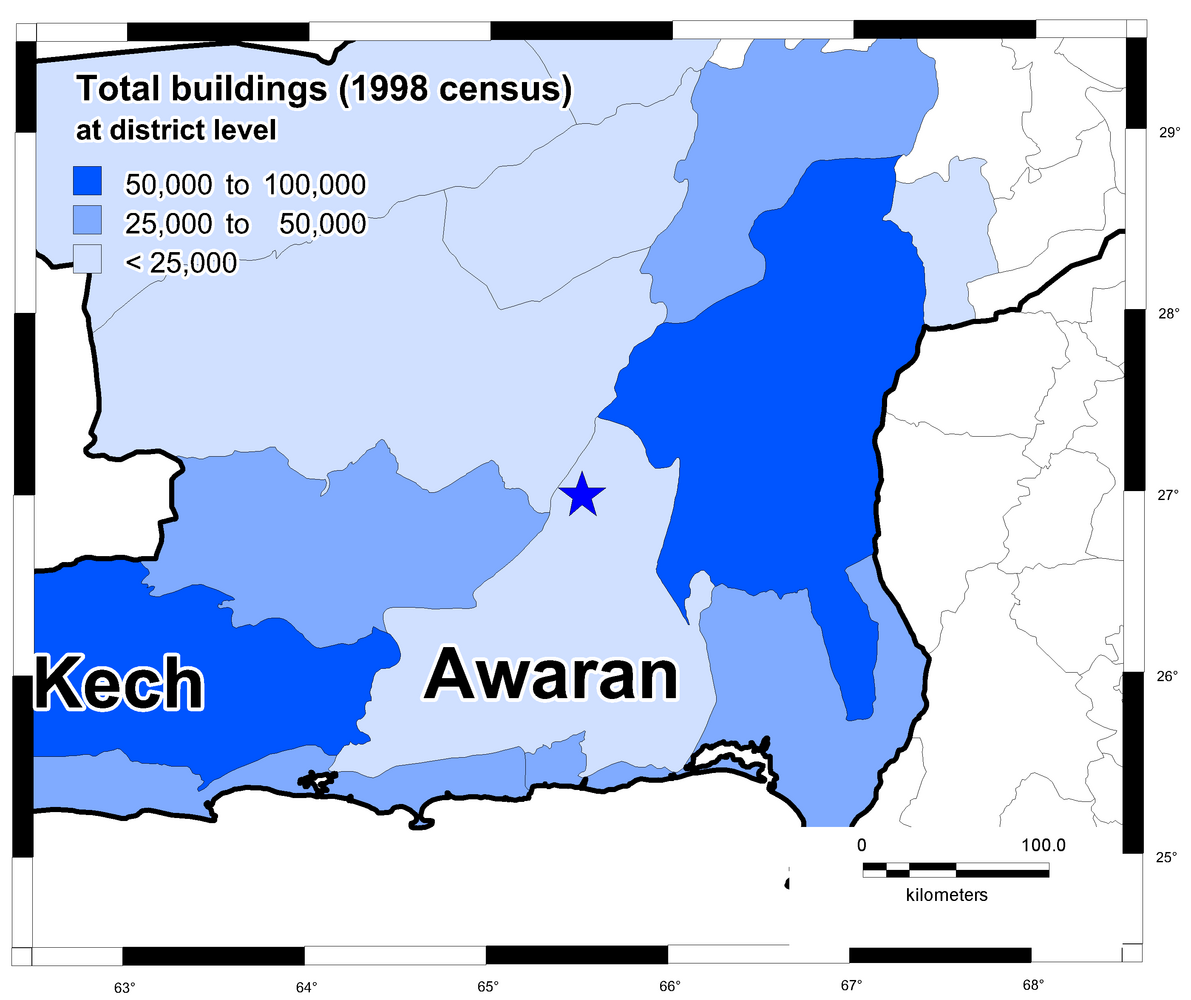
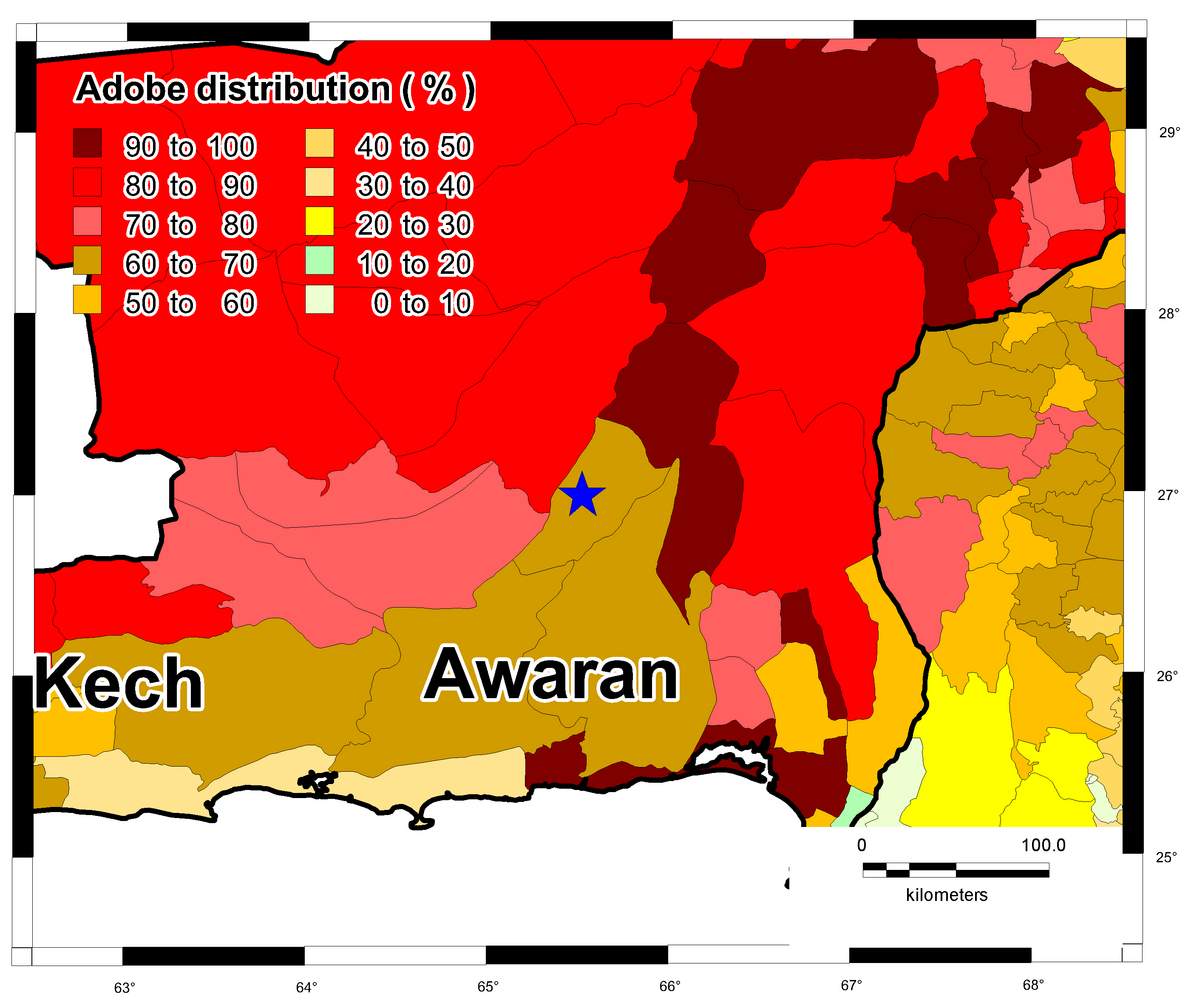
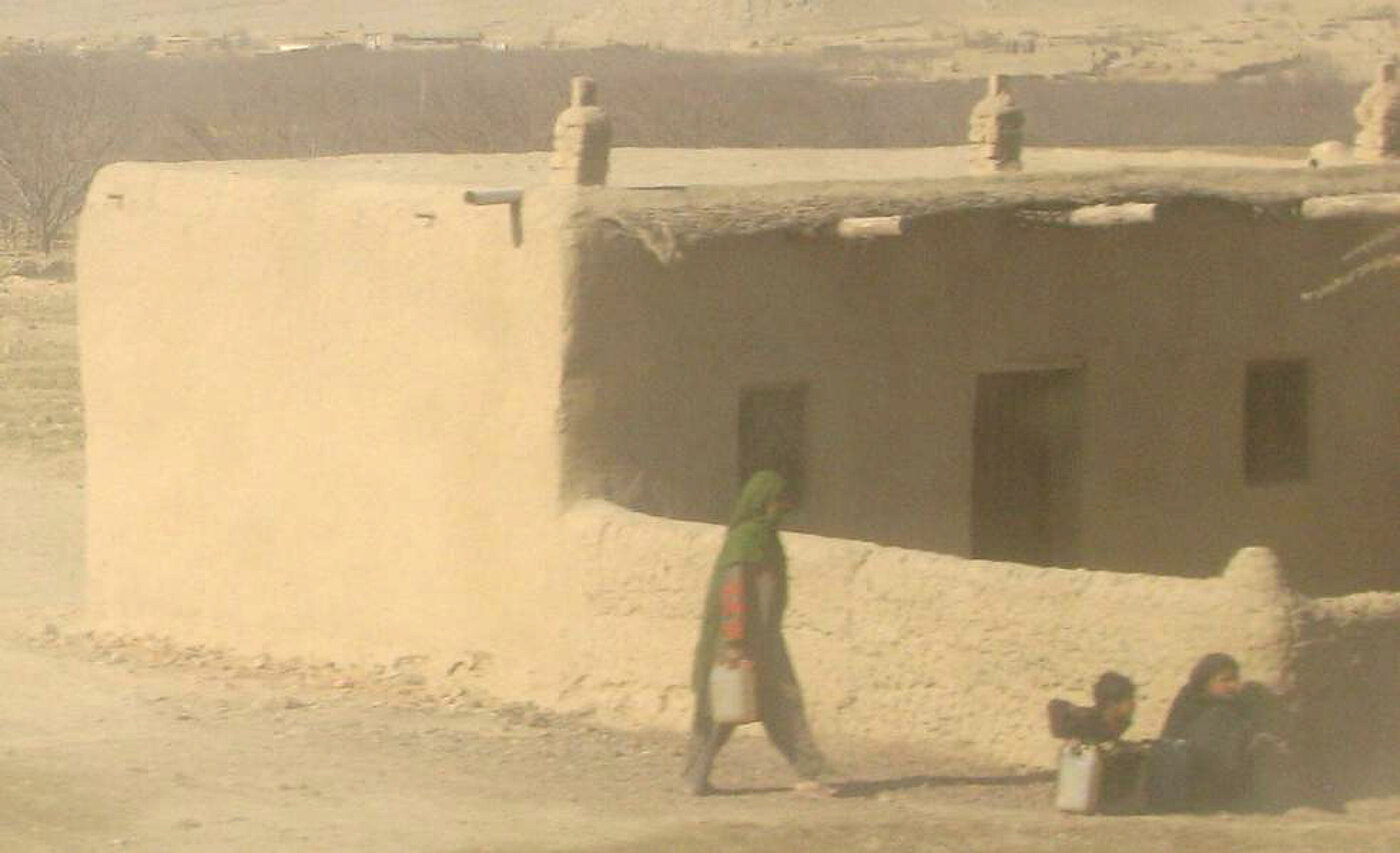
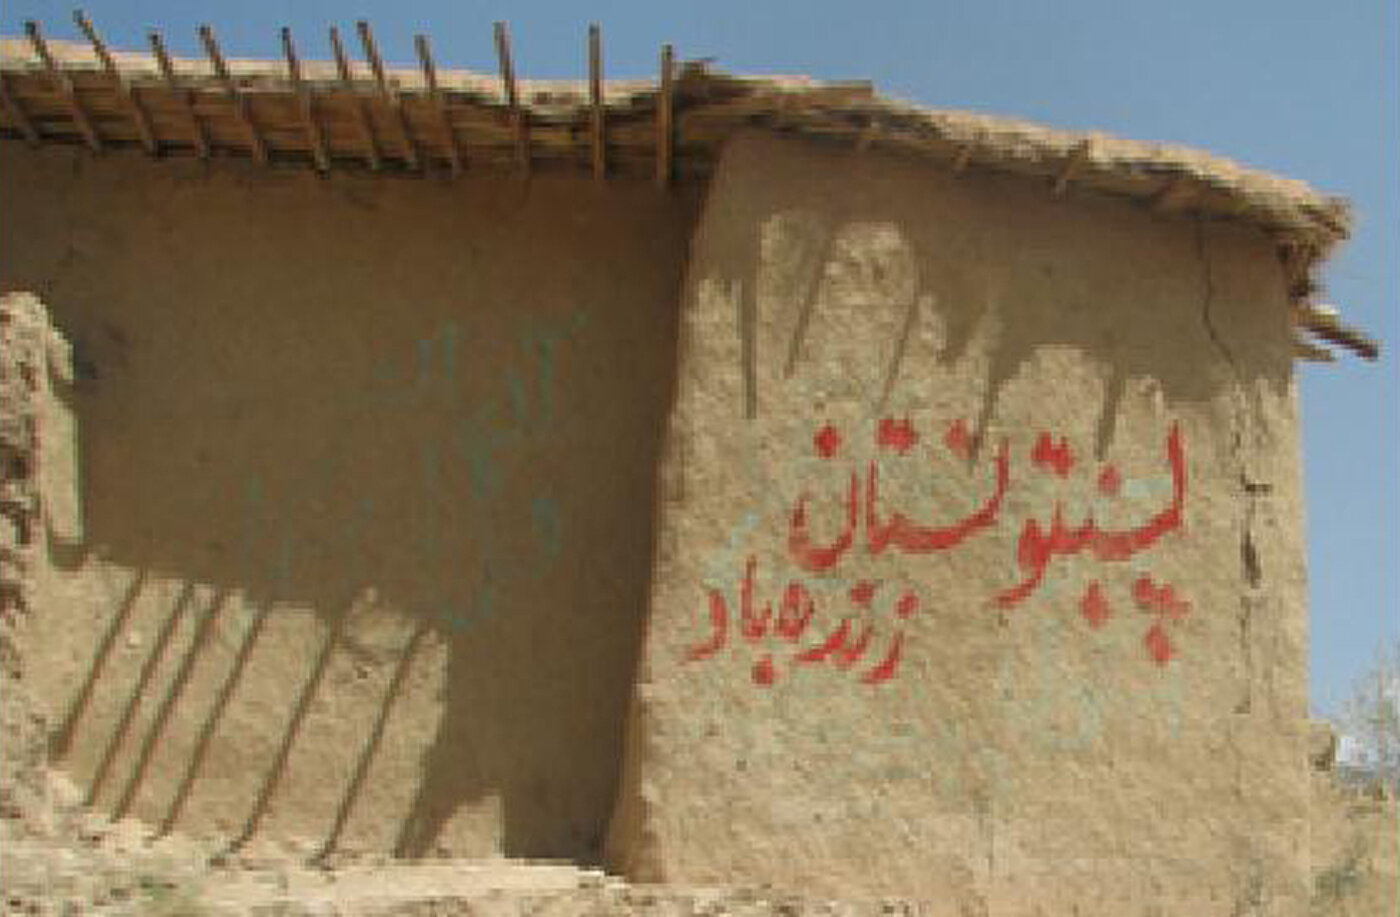
The affected area is characterized by low population (Fig. 2). The existing building stock is characterized as adobe buildings mainly using natural materials. Damage pictures show that sun-dried mud brick buildings, which are typical in this region, dominate the existing building stock (Fig. 3). The region is difficult to access due to mountainous terrain (see Fig. 11). The road near the epicenter is completely inaccessible/not recommended for traffic (NDMA, 2013b), marked as red in Fig. 11. It is possibly due to landslide in that hilly area. The road marked as blue in Fig. 11 is accessible for all kinds of traffic as the terrain is relatively not so high along this road. The road marked as magenta in Fig. 11 is only accessible for traffic up to 30 meters (possibly due to landslide). This also has the consequence that assistance can arrive only after some time. In this respect, the information about the number of casualties is still unclear and initial data of several hundred casualties can still be regarded as the lower limit.
According to the National Disaster Management Authority Pakistan with reports from 26.09.2013 (NDMA, 2013a) and 05.10.2013 (NDMA, 2013b) following are the estimates of the casualties and number of destroyed buildings:
District | Deaths | Injured | Estimated houses damaged |
Awaran | 330 | 584 | 21,000 |
Kech | 46 | 240 |
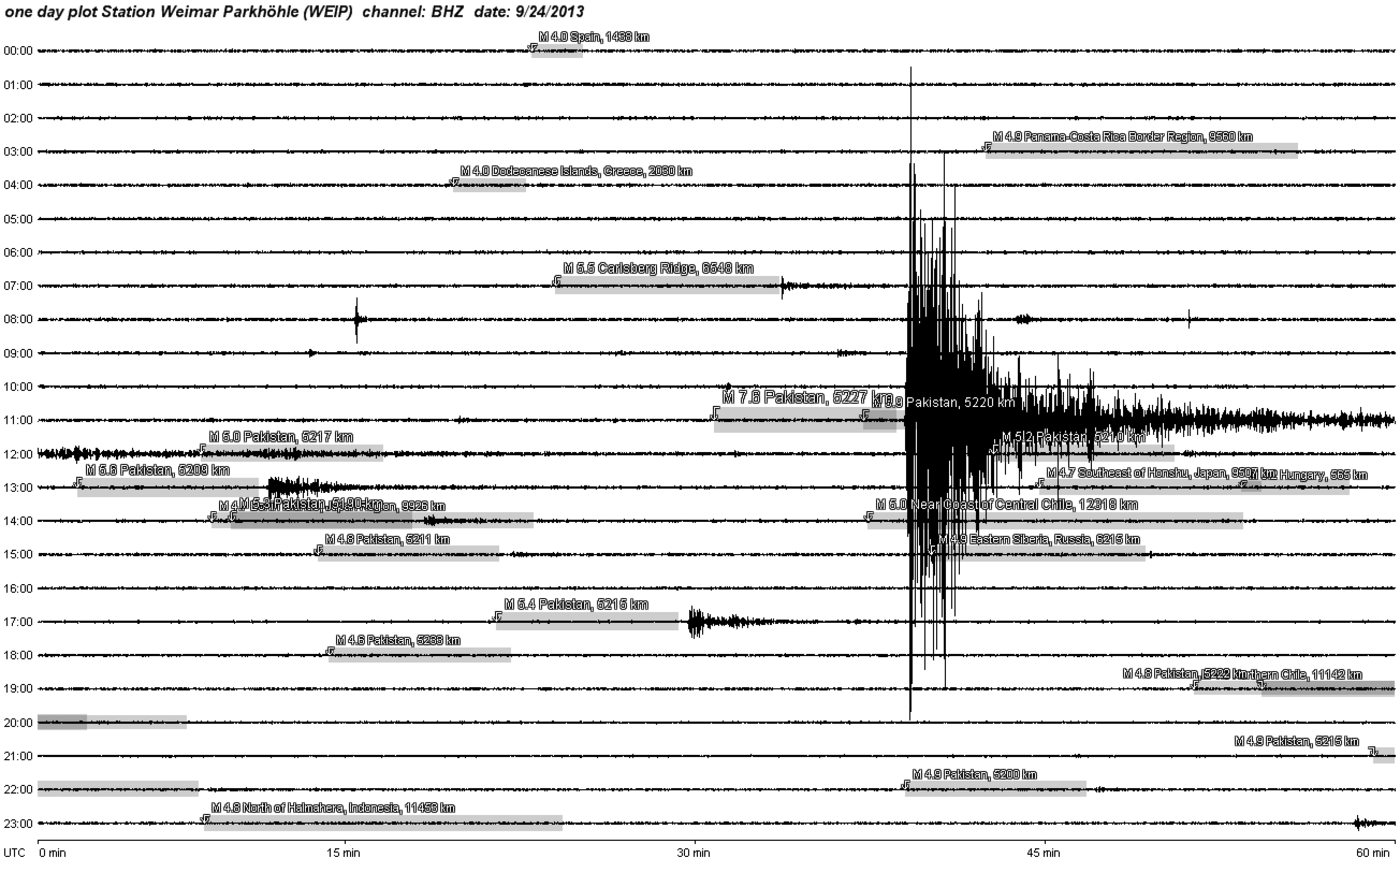
The heavy tremors were registerd also at the station in the Parkhöhle Weimar (Fig. 4a, 4b).

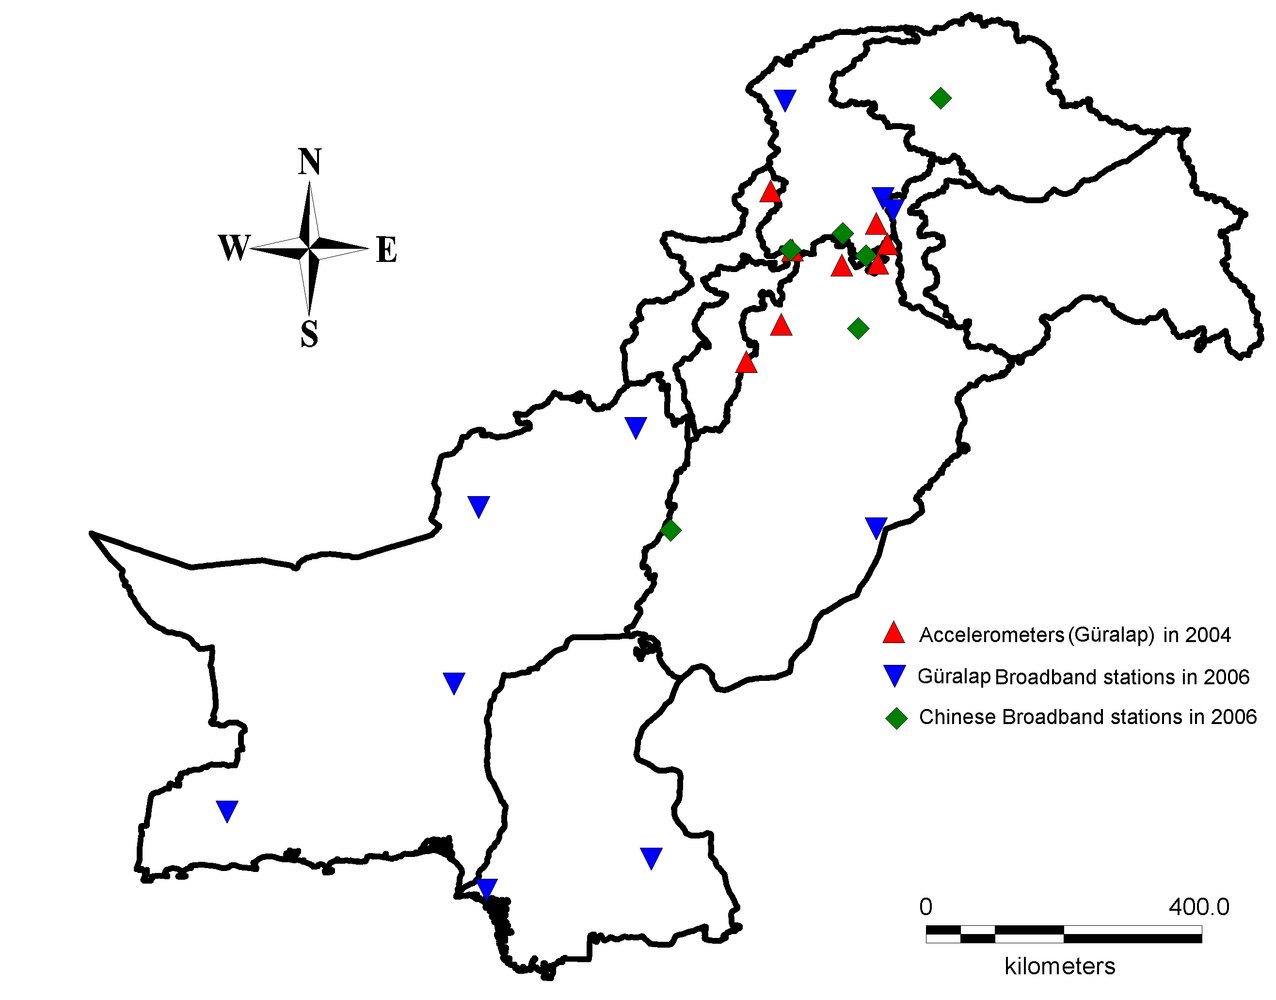
Registered strong motion earthquake records are not currently available. The monitoring network in Pakistan has some stations; however, it does not capture the most affected region (Fig. 5). The nearest stations were installed after the devastating 8th October 2005 Kashmir earthquake. Consequently the relevant data for the damage interpretation is not available.
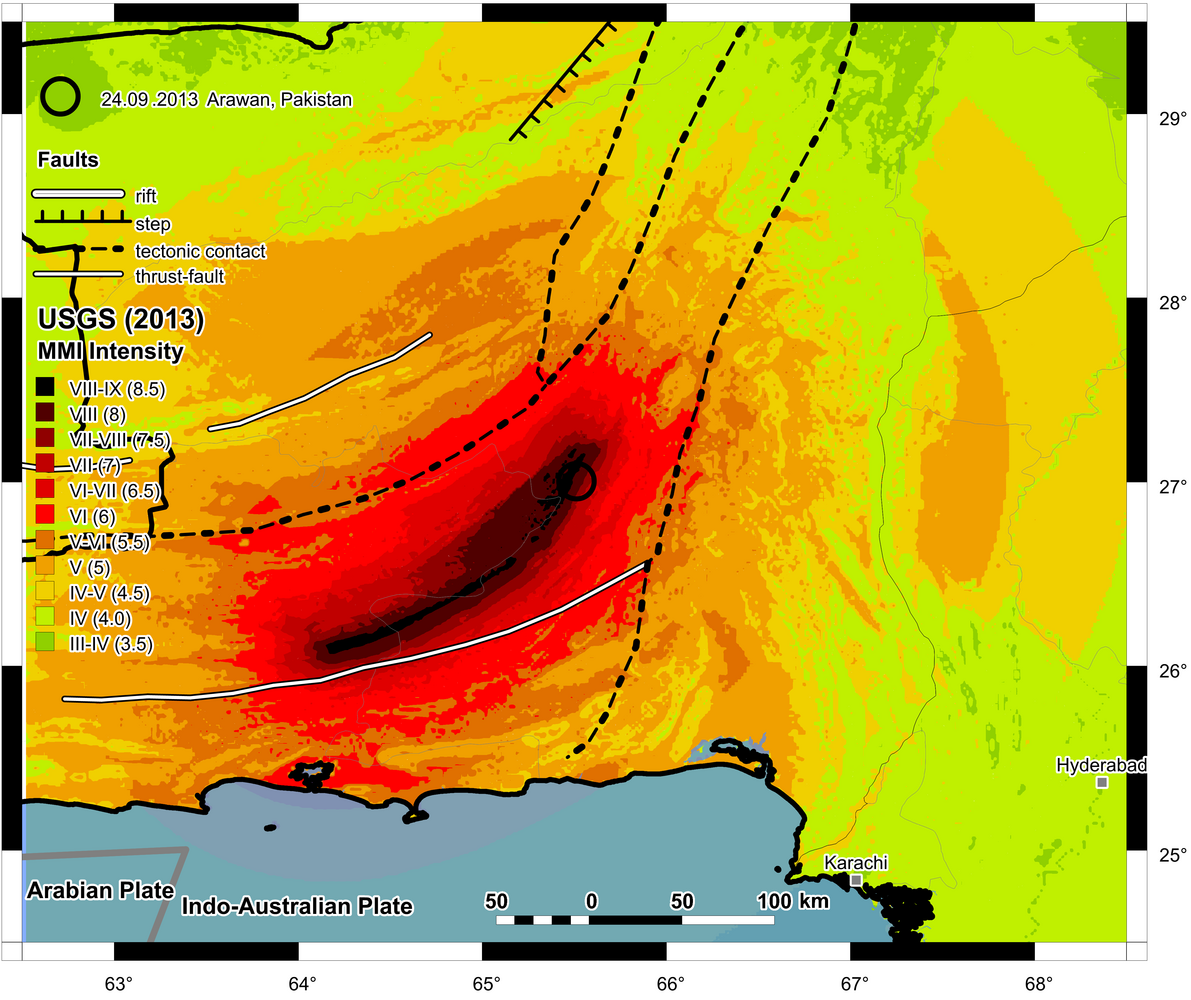
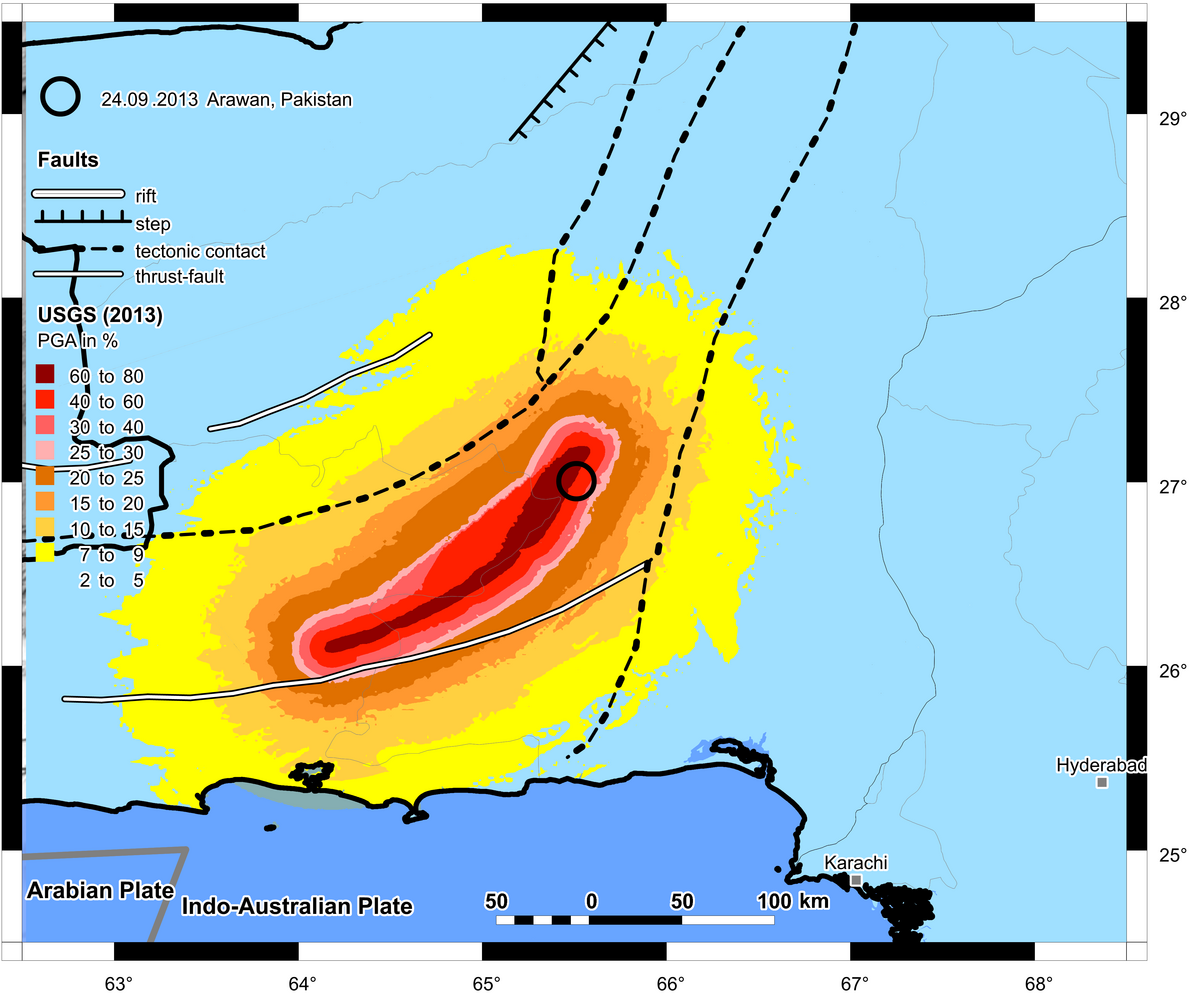
Fig. 1 illustrates the location of the faults and the possible position of the epicenter, based on the information provided by the USGS. For the area USGS has prepared the ShakeMaps that are included in the figures 6 and 7 in the form of Modified Mercalli Intensity (MMI) and Peak Ground Acceleration (PGA) respectively. Based on the prognosis map it can be deduced that peak ground acceleration values could have reached between 0.3 - 0.5 g at the epicenter. The existing buildings cannot sustain such strong ground motions without damage or collapse. In this respect, the damages are expected to be increased from the one reported so far. Investigations by EDAC for the target region Pakistan provide information on the distribution of the building stock. Again, it is clear that adobe buildings are dominant building type in the epicentral area (Fig. 2).
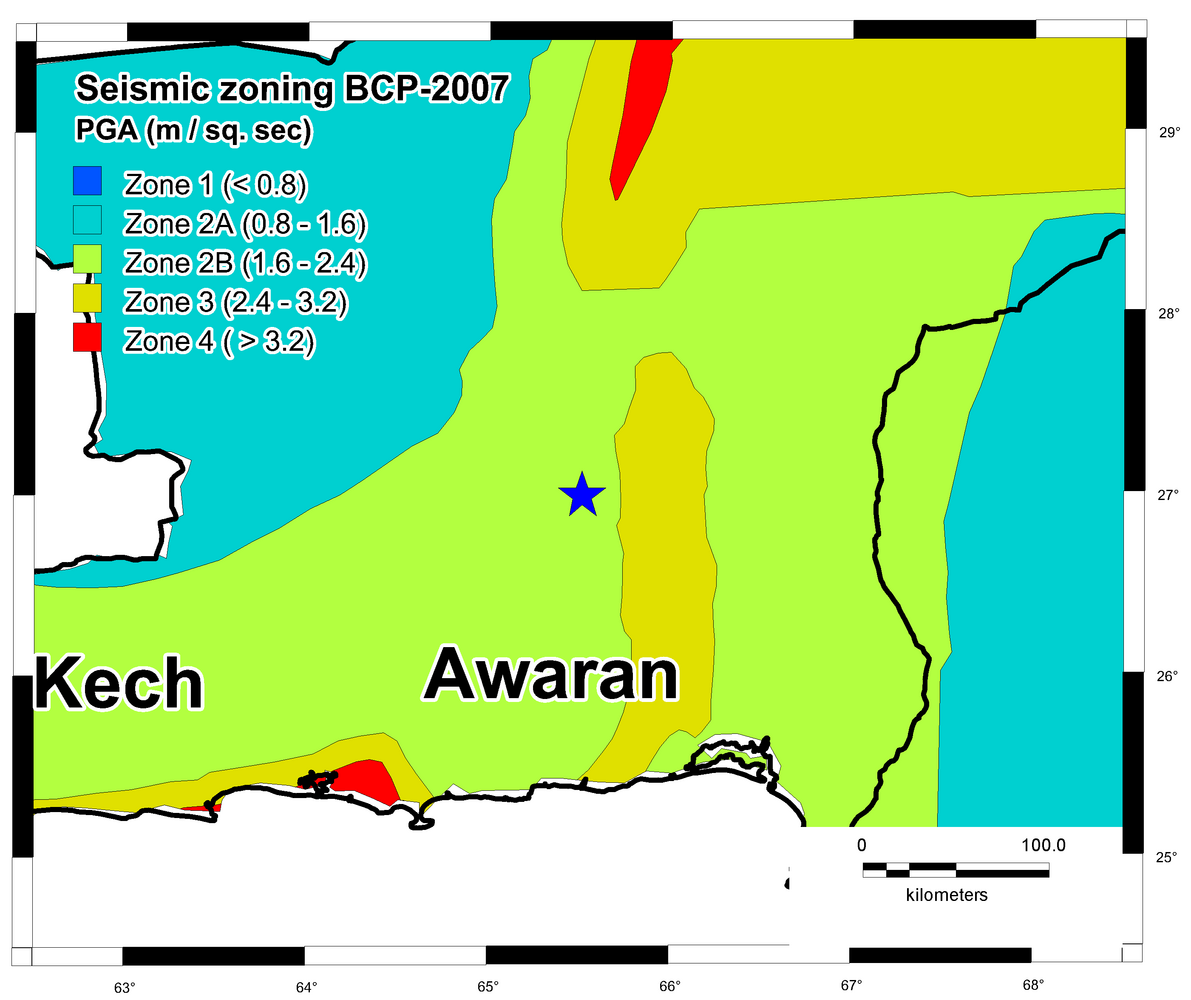
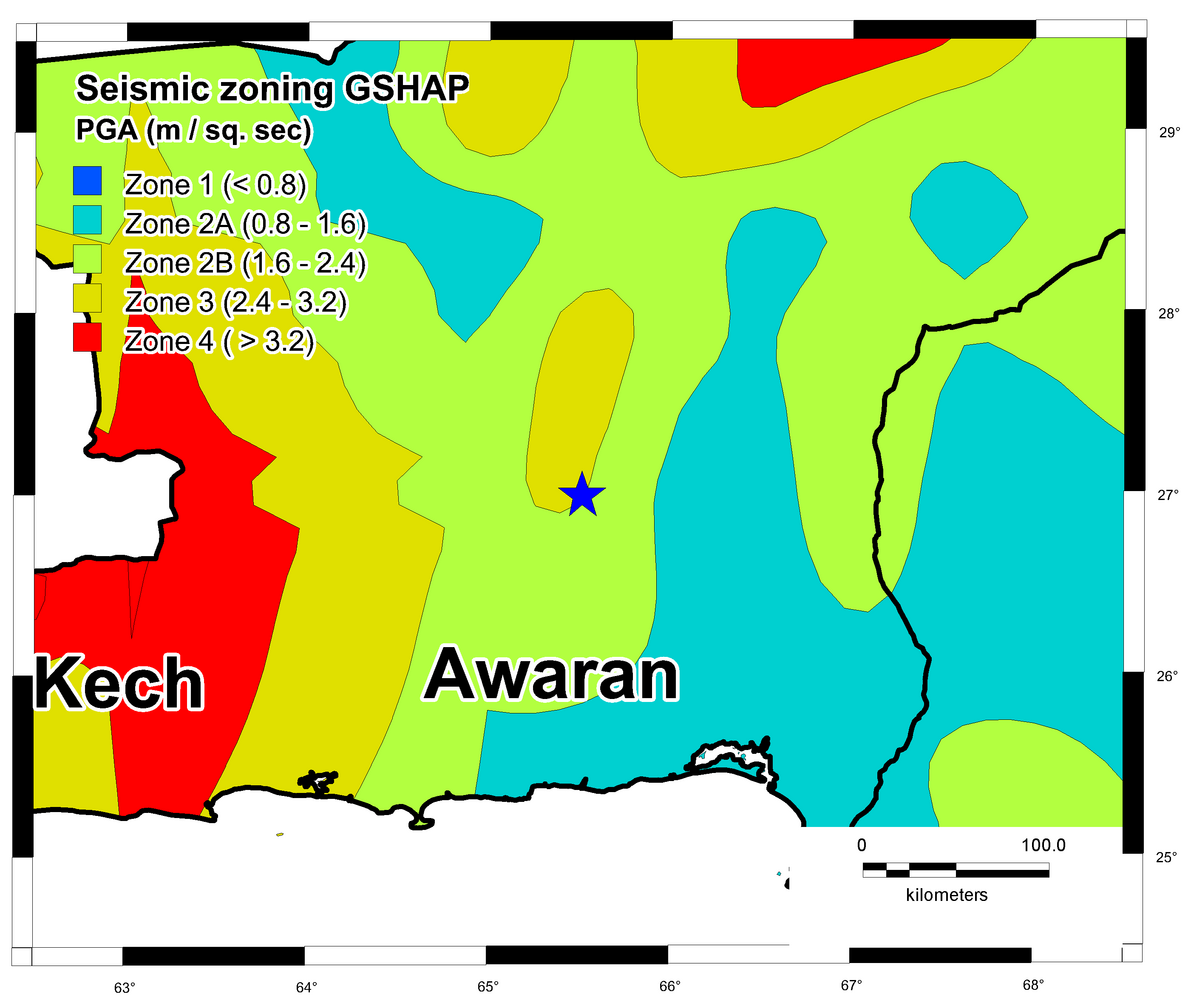
The severity of the earthquake is not adequately represented by the current seismic zoning map of Pakistan. It can be demonstrated using the seismic zoning map of BCP (2007) (Fig. 8). The epicentral area is in Zone 2B and is therefore classified as moderate. This is undoubtedly incorrect, but the building code has little consequence, as the adobe construction is not considered in the code. Also, the Global Seismic Hazard Map (GSHAP), indicates moderate hazard level for the epicentral area (Fig.9). Appropriate measures should be taken to improve the seismic zoning map near the epicentral region.
The multi-hazard map that takes into account various natural hazards identifies this area as earthquake dominant. Hence it verifies that the probability of occurrence of a specific natural hazard is correctly shown in the map (Fig. 10).
Legend:
Earthquake Hazard Dominated Areas (EHDA),
Flood Hazard Dominated Areas (FHDA),
Combined Hazard Dominated Areas (CHDA),
No Hazard Dominated Areas (NHDA)


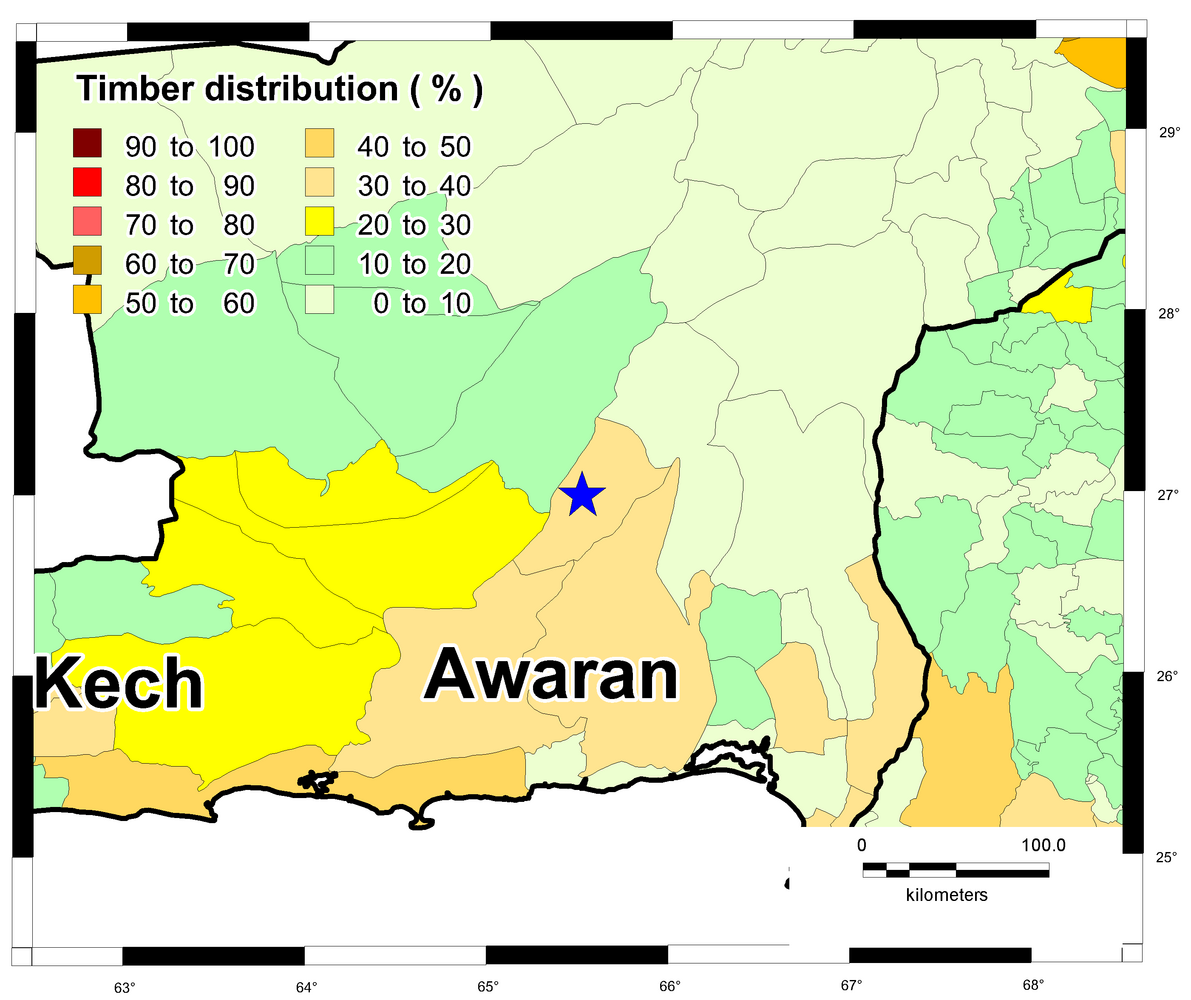
The damages were concentrated on sparsely populated epicentral region. In the more distant larger cities (in north: Quetta, south west: Karachi) no significant damage have been recorded. Damage patterns of the dominant building type adobe show partial collapse of the massive masonry buildings, which are designed mainly single-story (see Fig. 12). The damages significantly depend upon the type of floor or roof system. There are different possibilities. Besides light wooden roofs, rarely reinforced concrete slabs (in public buildings) are also present. This type of construction relates primarily to the public domain and may explain the failure of school buildings and other public buildings. The failure modes are typical for adobe buildings and characterized by the out of plane failure of the walls and the failure of the roof due to lack of connection between the roof and the missing wood or reinforced concrete ring beam.
Replacement of the construction methods, in this region can only be made with locally available materials. Both the climatic aspects as well as the earthquake consequences should be considered in new constructions. Consequently wooden elements can be used in walls as an alternative, in cooperation with other suitable proposals used in other earthquake prone regions.
Literature
BCP (2007). Building Code of Pakistan (Seismic Provisions 2007). Ministry of Housing and Public Works Islamabad.
Becker, J. J.; Sandwell, D. T.; Smith, W. H. F.; Braud, J.; Binder, B.; Depner, J.; Fabre, D.; Factor, J.; Ingalls, S.; Kim, S.-H.; Ladner, R.; Marks, K.; Nelson, S.; Pharaoh, A.; Trimmer, R.; von Rosenberg, J.; Wallace, G.; Weatherall, P. (2009): Global Bathymetry and Elevation Data at 30 Arc Seconds Resolution: SRTM30_PLUS. In: Marine Geodesy, Bd. 32 (2009) Nr. 4, S. 355–371, doi:10.1080/01490410903297766, . – SRTM30 Plus V6.0 data files.
gadm.org (2012): Global Administrative Areas., Karte, . – Version 2.0. [online] gadm.org/download_country.html (Letzter Zugriff 2013-09-25).
Giardini, G.; Grünthal, G.; Shedlock, K.; Zhang, P. (1999): The GSHAP Global Seismic Hazard Map. [online] www.gfz-potsdam.de/gshap/.
Maqsood, S. T. (2011). Elaboration of Data Layers for Global Earthquake Models: Case Study Pakistan. Schriftenreihe des Instituts für Konstruktiven Ingenieurbau, Bauhaus-Universität Weimar Heft 021 (2011), 217 S., ISBN: 978-3-86068-461-0.
Maqsood, S. T.; Schwarz, J. (2010): Building Vulnerability and Damage during the 2008 Baluchistan Earthquake in Pakistan and Past Experiences. In: Seismological Research Letters, 81 (2010) 3, 514–525, doi:10.1785/gssrl.81.3.514.
Maqsood, S. T.; Schwarz, J. (2008): Analysis of Building Damage during the 8 October 2005 Earthquake in Pakistan. In: Seismological Research Letters, 79 (2008) 2, 163–177, doi:10.1785/gssrl.79.2.163.
NDMA (2013a). National disaster management authority, Pakistan. www.ndma.gov.pk/Ex/Documents/26-9-2013Situationreportc.pdf.
NDMA, (2013b). National disaster management authority, Pakistan. www.ndma.gov.pk/Ex/Documents/5-10-2013Situationreport.pdf.
Qaisar, M., Mahmood, T. (2013): Strong Motion Seismology in Pakistan. Proceedings of Workshop for Regional Cooperation in Seismology and Earthquake Engineering in South and Central Asia, 16 - 19 Sept, 2013, Nagarkot, Bhaktapur, Kathmandu, Nepal.
Shahid, M. (2011) National Seismic Monitoring Network of Pakistan Meteorological Department (PMD).
Siddique, M.S. and Schwarz, J. (2012): Multi-hazard approach to assess vulnerability of the building stock in Pakistan. Proceedings of the 15th World Conference Earthquake Engineering, Lisbon, Portugal, Paper No. 1152.
U.S. Geological Survey: Earthquake Hazard Program. earthquake.usgs.gov/earthquakes/search/.
USGS (2009): Global GIS Databases - Datasets. [online] webgis.wr.usgs.gov/globalgis/datasets.htm (Letzter Zugriff 2010-03-04).
USGS (2013): M7.7 - 63km NNE of Awaran, Pakistan 2013-09-24 11:29:47 UTC., Karte. [online] earthquake.usgs.gov/earthquakes/eventpage/usb000jyiv#summary (Letzter Zugriff 2013-09-25, Map Version 5).